Collecting Plasma in the US: Ecosystem Analysis, Cost Benchmarking & Forecast to 2030

Announcement
COLLECTING PLASMA IN THE US:
ECOSYSTEM ANALYSIS, COST BENCHMARKING & FORECAST TO 2030
INTRODUCTION
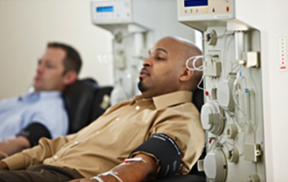 Over the past decade, US source plasma collections have grown tremendously, at a ~12% annual growth rate from 2010 to 2019. Over that period, the number of collection centers has more than doubled, to over 900 in 2020. To achieve this expansion, a great deal of capital investment was made by both the plasma collectors owned by the fractionators, and by the independent plasma collection companies. These investments comprised new construction, renovation, purchase or leasing of plasmapheresis machines and software, upgrading data processing and donation recording and tracking, staff recruiting and training, and more. As the plasma collection industry has grown, it has become more efficient by utilizing sophisticated software systems, new apheresis devices, and improving processes, all while focusing on donor throughput times and satisfaction. At the same time, these improvements have made the industry far more complex. This, coupled with an escalation in the competitive environment has raised questions about the optimization of collection practices, the baseline cost of collections, the pros and cons of the many vendors and their offerings, and what are the industry benchmark numbers. This information is critical for those considering entering or investing in this competitive and complex but promising industry.
OBJECTIVES
This report is a comprehensive resource of information which provides a clear and complete understanding of the plasma collections industry. It includes a detailed description on the collection process along with relevant data/benchmarking on the center operations, and on the major vendors that support the industry.
The report begins with a broad background and history of plasma collection and how it influences the present environment. The current state of the plasma collections landscape is then described and includes key data, such as the average annual or monthly/weekly collection volumes per center or per donation bed across the industry. The future challenges faced by the plasma collection industry are then presented, given the increasing competition in the space. The report forecasts the numbers of plasma centers and of source plasma collections by year until 2030, with assumptions for the outcome.
The report also covers current market price of plasma along with the current collection costs broken down by process/cost item. It discusses the entire plasma collection process in detail, providing average collection times and important aspects to consider when running plasma collection centers. It also provides information on the regulatory environment in which the industry operates (FDA, PPTA), and offers benchmarking data on new center development, including timelines and cost.
The final third of the report delves into the various vendors that service the industry including the providers of collection devices (Haemonetics/Fresenius Kabi USA, and new entrats.), donor management software systems (Haemonetics/Mak Systems), testing services, donor payment processing, and product shipment/storage services. The relative strengths and weaknesses of each of these vendors are analyzed, based on customer assessments.
After reviewing the report, the reader will have a clear and full understanding of the industry workings, as well as of the human and material resources and what investments that are necessary to succeed as a collector or vendor. This report will support companies in their long-range planning efforts and help decide about investing or entering the plasma collection business. Furthermore, the baseline data will allow new entrants to track their progress against their established competitors. Overall, this report will serve as an essential handbook for new entrants into this dynamic but obscure industry and for those who are already involved in it in various capacities.
The table of contents are enclosed below:
Table of Contents
- Historical Background
- Plasma Center Landscape – Current Locations, Trends & Growth Challenges
- Forecast of the Number of US Centers from 2020 to 2030 by Company
- Forecast of US Plasma Collections from 2020 to 2030 in liters
New Center Development
- Lifecycle and Timelines
- Budget/Cost
- Fixed Cost and Equipment
Collection Process and Plasma Center Operations
- Plasma Collection Cost by Key Component/Cost Benchmarking Analysis
- Forecast of Collection Costs by Component to 2030
- Process and Timing
- Employee Costs/Training and Other Considerations
Regulatory Environment
- Overview of Federal, State and Local Regulations
- Overview of IQPP certified and FDA License
Collection devices (Overview, Strengths, Weaknesses, Focus)
- Haemonetics
- Fresenius Kabi USA
- Others in Development
Software
- Haemonetics
- Mak Systems
- Internal Systems/ Others
Plasma Testing (NAT costs, etc.)
Donor Payment Methods and Cost
Plasma Shipment and Storage
Donor Marketing